Memory Management & Compression - dask_setup Recipe
This notebook demonstrates how dask_setup sizes worker memory, when workers spill to disk, how to
measure spilling, and what spill compression buys you.
Key Learning Points
How
dask_setupdivides memory between the OS reserve and the workersMemory spilling thresholds and when they trigger
Measuring real spill volume from the scheduler (not disk usage)
Choosing a spill compression codec that is actually installed
Letting
tune_memory_thresholds()adjust thresholds from observed spilling
Setup and Imports
Import necessary libraries and configure the environment for memory monitoring.
import threading
import time

import dask.array as da
import numpy as np
import psutil
from distributed import wait

PSUTIL_AVAILABLE = True

from dask_setup import DaskSetupConfig, cluster_report, setup_dask_client, tune_memory_thresholds
from dask_setup.reporting import scheduler_workers, worker_in_memory_bytes, worker_spill_bytes

try:
    import matplotlib.pyplot as plt
    PLOTTING_AVAILABLE = True
except ImportError:
    PLOTTING_AVAILABLE = False
    print("⚠️  matplotlib not available - plotting disabled")

print("🚀 Setup complete!")
🚀 Setup complete!
System Memory Information
Let’s examine the system’s memory configuration before we start our tests.
import os

print("💻 SYSTEM MEMORY ANALYSIS")
print("=" * 50)

if PSUTIL_AVAILABLE:
    # System memory
    mem = psutil.virtual_memory()
    swap = psutil.swap_memory()

    print(f"Physical Memory:")
    print(f"   Total: {mem.total / (1024**3):.2f} GB")
    print(f"   Available: {mem.available / (1024**3):.2f} GB")
    print(f"   Used: {mem.used / (1024**3):.2f} GB ({mem.percent:.1f}%)")
    print(f"   Free: {mem.free / (1024**3):.2f} GB")

    print(f"\nSwap Memory:")
    print(f"   Total: {swap.total / (1024**3):.2f} GB")
    print(f"   Used: {swap.used / (1024**3):.2f} GB ({swap.percent:.1f}%)")
    print(f"   Free: {swap.free / (1024**3):.2f} GB")

    # CPU information
    cpu_count = psutil.cpu_count(logical=False)
    cpu_logical = psutil.cpu_count(logical=True)

    print(f"\nCPU Information:")
    print(f"   Physical cores: {cpu_count}")
    print(f"   Logical cores: {cpu_logical}")

else:
    print("⚠️  System monitoring not available (psutil required)")

# Check environment variables for HPC
print(f"\n🖥️  HPC ENVIRONMENT VARIABLES:")
hpc_vars = {
    'PBS_JOBFS': 'Fast local storage directory',
    'TMPDIR': 'Temporary directory',
    'PBS_MEM': 'Allocated memory',
    'SLURM_MEM_PER_NODE': 'Memory per node (SLURM)'
}

hpc_detected = False
for var, description in hpc_vars.items():
    value = os.environ.get(var)
    if value:
        print(f"   {var}: {value} ({description})")
        hpc_detected = True

if not hpc_detected:
    print("   No HPC environment variables detected (running locally)")

print("\n✅ System analysis complete")
💻 SYSTEM MEMORY ANALYSIS
==================================================
Physical Memory:
   Total: 15.61 GB
   Available: 14.17 GB
   Used: 1.45 GB (9.3%)
   Free: 11.07 GB

Swap Memory:
   Total: 3.00 GB
   Used: 0.00 GB (0.0%)
   Free: 3.00 GB

CPU Information:
   Physical cores: 2
   Logical cores: 4

🖥️  HPC ENVIRONMENT VARIABLES:
   No HPC environment variables detected (running locally)

✅ System analysis complete
How dask_setup Sizes Worker Memory
Every worker gets a hard memory limit:
usable        = min(max_mem_gb, node RAM) − reserve_mem_gb
per-worker    = usable / n_workers
reserve_mem_gb is held back for the OS, page cache and filesystem clients. Left unset, it
defaults to 20% of RAM, clamped to 4–50 GB. If the per-worker share would fall below 1 GB,
dask_setup starts fewer workers rather than over-committing the node.
Dask then acts on four thresholds, each a fraction of the worker’s limit:
Threshold |
Default |
What happens |
|---|---|---|
|
0.75 |
start spilling least-recently-used data to disk |
|
0.85 |
spill based on process memory, not just tracked data |
|
0.92 |
stop starting new tasks on this worker |
|
0.98 |
the nanny kills and restarts the worker |
Lower memory_target / memory_spill to spill earlier (safer on tight nodes);
raise them to keep more in memory (faster when there is headroom).
Measuring Memory and Spill
The scheduler already tracks what each worker holds and how much of it is spilled.
worker_in_memory_bytes() and worker_spill_bytes() read the two figures from a worker’s
heartbeat metrics.
Measuring the free space of
$TMPDIRdoes not measure spilling: it reports how full the whole filesystem is, including everything else on it.
def cluster_memory_snapshot(client):
    """Data held in memory and spilled to disk, summed over all workers."""
    workers = scheduler_workers(client)  # every worker: scheduler_info() lists only 5
    return {
        "workers": len(client.nthreads()),
        "memory_gib": sum(worker_in_memory_bytes(w.get("metrics", {})) for w in workers.values()) / 2**30,
        "spill_gib": sum(worker_spill_bytes(w.get("metrics", {})) for w in workers.values()) / 2**30,
    }


def monitor_computation(client, computation_func, description="Computation", interval=0.5):
    """Run *computation_func* while sampling cluster memory and spill every *interval* seconds."""
    print(f"\n📊 Monitoring: {description}")
    timeline = []
    done = threading.Event()
    result = {}
    start = time.perf_counter()

    def run():
        try:
            result["value"] = computation_func()
        finally:
            done.set()

    thread = threading.Thread(target=run)
    thread.start()
    while not done.is_set():
        timeline.append({"t": time.perf_counter() - start, **cluster_memory_snapshot(client)})
        done.wait(interval)
    thread.join()
    timeline.append({"t": time.perf_counter() - start, **cluster_memory_snapshot(client)})

    peak_mem = max(p["memory_gib"] for p in timeline)
    peak_spill = max(p["spill_gib"] for p in timeline)
    print(f"   Time: {timeline[-1]['t']:.1f}s | peak memory {peak_mem:.2f} GiB | peak spill {peak_spill:.2f} GiB")
    return result.get("value"), timeline


print("✅ Memory monitoring functions defined")
✅ Memory monitoring functions defined
Memory Pressure Test
To see spilling on any machine, cap Dask at 3 GB and reserve 1 GB of it, which leaves 2 workers
with ~1 GB each. We then hold a 3.2 GB array in memory with .persist(), which is more than the
workers have, so they must spill.
PRESSURE_CONFIG = dict(
    workload_type="cpu",
    max_workers=2,
    max_mem_gb=3.0,      # cap Dask's total memory...
    reserve_mem_gb=1.0,  # ...and reserve 1 GB of it, leaving ~1 GB per worker
    dashboard=False,
)

client, cluster, temp_dir = setup_dask_client(**PRESSURE_CONFIG)

worker = next(iter(client.scheduler_info()["workers"].values()))
print(f"✅ {len(client.nthreads())} workers, "
      f"{worker['memory_limit'] / 2**30:.2f} GiB limit each")
print(f"   Spill directory: {temp_dir}")
[setup_dask_client] Configuration summary
temp/spill dir: /tmp/dask-2592
Workers: 2 | threads/worker: 1 | processes: True
Memory: total ~15.6 GiB | usable ~2.0 GiB | per-worker ~1.0 GiB
Compression: spill=auto | comm=False
✅ 2 workers, 1.00 GiB limit each
   Spill directory: /tmp/dask-2592
def make_pressure_computation(n=20_000, chunk=2_000):
    """Persist an n×n float64 array (3.2 GB at the default size), then reduce it."""
    def run():
        x = da.random.random((n, n), chunks=(chunk, chunk)).persist()
        wait(x)  # everything is now held by the workers, in memory or on disk
        return float(x.mean().compute())
    return run


result, memory_timeline = monitor_computation(
    client, make_pressure_computation(), "Persist 3.2 GB on ~2 GB of workers"
)
print(f"\n✅ Result: {result:.6f}")
📊 Monitoring: Persist 3.2 GB on ~2 GB of workers
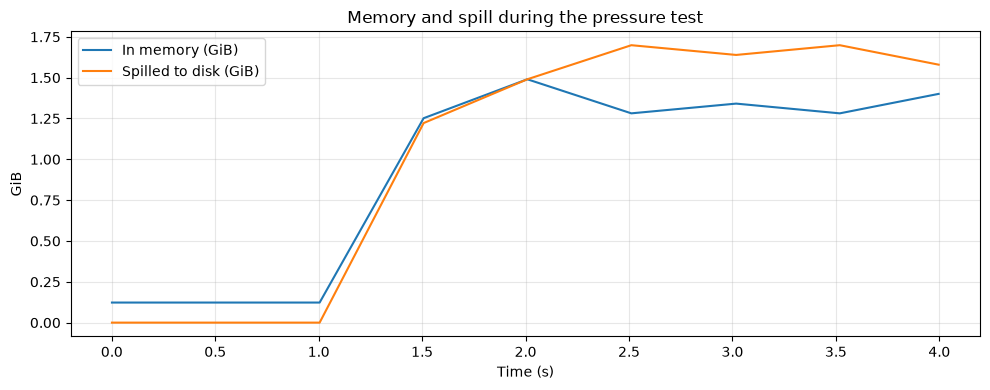
   Time: 4.0s | peak memory 1.49 GiB | peak spill 1.70 GiB

✅ Result: 0.499999
Memory Timeline
cluster_report() gives the same headline numbers without any monitoring thread: call it
before closing the client, e.g. at the end of a batch job.
report = cluster_report(client)
print(report.summary_line())
print(f"Spilled to disk: {report.total_spill_gib:.2f} GiB")
workers=2 | mem=0.72 GiB/max | spill=1.58 GiB
Spilled to disk: 1.58 GiB
Memory Usage Visualization
Managed memory plateaus near the workers’ target, while spill keeps growing to absorb the rest.
if PLOTTING_AVAILABLE:
    t = [p["t"] for p in memory_timeline]
    fig, ax = plt.subplots(figsize=(10, 4))
    ax.plot(t, [p["memory_gib"] for p in memory_timeline], label="In memory (GiB)")
    ax.plot(t, [p["spill_gib"] for p in memory_timeline], label="Spilled to disk (GiB)")
    ax.set_xlabel("Time (s)")
    ax.set_ylabel("GiB")
    ax.set_title("Memory and spill during the pressure test")
    ax.grid(alpha=0.3)
    ax.legend()
    plt.tight_layout()
    plt.show()
else:
    for p in memory_timeline:
        print(f"{p['t']:5.1f}s  memory={p['memory_gib']:.2f} GiB  spill={p['spill_gib']:.2f} GiB")

client.close()
cluster.close()
Compression Algorithm Comparison
Spill compression is set with DaskSetupConfig(spill_compression=...). Dask can only use codecs
whose packages are installed, and an unavailable one stops workers from starting at all. So ask
distributed what this environment supports:
"auto": lz4 if installed, else snappy, else no compression. The safe default."lz4"/"snappy": fast; needpip install lz4/pip install python-snappy"zstd": better ratio, more CPU; needspip install zstandard"zlib": always available, but slow
We spill small integers, which compress well, so the codecs’ differences are visible. (Random floats barely compress at all.)
from distributed.protocol.compression import compressions

available = [name for name in compressions if isinstance(name, str) and name != "auto"]
print(f"Codecs available here: {available}")


def compressible_pressure():
    x = da.random.randint(0, 10, size=(20_000, 20_000), chunks=(2_000, 2_000)).persist()
    wait(x)
    return int(x.sum().compute())


compression_results = {}
# zlib is left out: it took ~70 s here against ~5 s for the others.
for codec in ["auto", *(c for c in available if c != "zlib")]:
    config = DaskSetupConfig(**PRESSURE_CONFIG, spill_compression=codec)
    client, cluster, _ = setup_dask_client(config=config)
    start = time.perf_counter()
    compressible_pressure()
    elapsed = time.perf_counter() - start
    compression_results[codec] = {"seconds": elapsed, **cluster_memory_snapshot(client)}
    client.close()
    cluster.close()
Codecs available here: ['zlib']
[setup_dask_client] Configuration summary
temp/spill dir: /tmp/dask-2592
Workers: 2 | threads/worker: 1 | processes: True
Memory: total ~15.6 GiB | usable ~2.0 GiB | per-worker ~1.0 GiB
Compression: spill=auto | comm=False
Compression Results
The spill column is bytes on disk, after compression.
print(f"{'codec':<8}{'time (s)':>10}{'spilled to disk (GiB)':>24}")
print("-" * 42)
for codec, r in sorted(compression_results.items(), key=lambda kv: kv[1]["seconds"]):
    print(f"{codec:<8}{r['seconds']:>10.1f}{r['spill_gib']:>24.2f}")
codec     time (s)   spilled to disk (GiB)
------------------------------------------
auto           5.1                    1.73
Memory Management Best Practices
Compression
Use
spill_compression="auto"unless you have measured something better; it never fails to start.On
$PBS_JOBFS(local SSD), spill I/O is cheap: prefer a fast codec (lz4) over a strong one.If spill has to land on a shared filesystem, a stronger codec (zstd) reduces the load on it.
Thresholds
Workers killed or restarting → lower
memory_target/memory_spillso they spill earlier, or give each worker more memory.Heavy spilling on a node with free RAM → you are reserving too much: lower
reserve_mem_gb.
Worker count
Memory per worker is
usable / n_workers. If single tasks need more than that, use fewer workers (max_workers=) or smaller chunks (recommend_chunks()), not a bigger reserve. Raisingreserve_mem_gbtakes memory away from the workers.
Storage
On Gadi,
dask_setupspills to$PBS_JOBFSautomatically. Request enough of it:#PBS -l jobfs=...should cover your expected peak spill.
# Conservative settings for a memory-constrained node
conservative = DaskSetupConfig(
    workload_type="cpu",
    reserve_mem_gb=4.0,
    memory_target=0.60,
    memory_spill=0.70,
    memory_pause=0.85,
    memory_terminate=0.95,
    spill_compression="auto",
)
for field in ("reserve_mem_gb", "memory_target", "memory_spill", "memory_pause",
              "memory_terminate", "spill_compression"):
    print(f"{field:<18} {getattr(conservative, field)}")
reserve_mem_gb     4.0
memory_target      0.6
memory_spill       0.7
memory_pause       0.85
memory_terminate   0.95
spill_compression  auto
Let dask_setup Tune the Thresholds
tune_memory_thresholds() reads the spill metrics from a running cluster and moves
memory_target / memory_spill on every worker: it tightens them when there was little
spilling (more OOM headroom) and loosens them when there was a lot (less disk I/O).
setup_dask_client(adaptive_memory=True) runs it once at startup, before anything has
spilled, so it always tightens; call it yourself between pipeline stages to react to real spill.
client, cluster, _ = setup_dask_client(**PRESSURE_CONFIG)
make_pressure_computation()()

tuned = tune_memory_thresholds(client)
print(tuned.summary())

client.close()
cluster.close()
[setup_dask_client] Configuration summary
temp/spill dir: /tmp/dask-2592
Workers: 2 | threads/worker: 1 | processes: True
Memory: total ~15.6 GiB | usable ~2.0 GiB | per-worker ~1.0 GiB
Compression: spill=auto | comm=False
Memory thresholds adjusted on 2 worker(s): target 75%→80%, spill 85%→90% (high spill (1.76 GiB ≥ 0.50 GiB threshold); loosened thresholds to reduce disk write amplification)
Conclusion
Key Takeaways:
Per-worker memory is
(min(max_mem_gb, RAM) − reserve_mem_gb) / n_workers; the reserve comes out of the workers’ shareThresholds decide when workers spill, pause and are killed; lower them to spill earlier
Measure spill from the scheduler (
cluster_report(),worker_spill_bytes()), not from disk usageCompression only works with installed codecs;
"auto"is always safeTuning: call
tune_memory_thresholds()between stages to adjust to the spill you observed
Troubleshooting Guide:
Workers killed / restarting: lower
memory_target, use fewer workers, or smaller chunks“Nanny failed to start” with spill compression set: the codec isn’t installed; use
"auto"Slow with heavy spilling: lower
reserve_mem_gbif RAM is free, or request more memorySpill filling the disk: request more
jobfs, or use a stronger codec