Performance Optimization & Scaling — dask_setup Recipe
This notebook covers the three main levers for tuning dask_setup performance:
Worker count scaling — speedup and efficiency vs. number of workers
Workload type comparison — cpu vs. io vs. mixed for different task mixes
Chunk size impact — how chunk size affects throughput and memory
Using the built-in benchmarking API (
benchmark_config,scaling_analysis,chunk_impact)
Setup
import time

import dask.array as da
import numpy as np
import xarray as xr

from dask_setup import setup_dask_client
from dask_setup.config import DaskSetupConfig
from dask_setup.benchmark import (
    benchmark_config,
    scaling_analysis,
    chunk_impact,
    run_synthetic_benchmark,
)

try:
    import matplotlib.pyplot as plt
    PLOT = True
except ImportError:
    PLOT = False
    print("matplotlib not found — plots disabled")

print("Imports OK")
Imports OK
1. Quick Synthetic Benchmark
run_synthetic_benchmark() runs without any real dataset — perfect for quickly
checking how a profile performs on your machine.
result = run_synthetic_benchmark(
    profile_name="development",
    operation="mean",
    ds_size="small",
    repeats=2,
    verbose=True,
)
print()
print(result.summary())
Creating synthetic array (500, 500, 20) chunked (100, 100, 20) …
[setup_dask_client] Configuration summary
temp/spill dir: /tmp/dask-3223
Workers: 2 | threads/worker: 2 | processes: True
Memory: total ~15.6 GiB | usable ~7.6 GiB | per-worker ~3.8 GiB
Compression: spill=auto | comm=False
Cluster ready: 2 workers. Running 'mean' × 2 …
/opt/hostedtoolcache/Python/3.13.15/x64/lib/python3.13/site-packages/distributed/client.py:3429: UserWarning: Sending large graph of size 19.08 MiB.
This may cause some slowdown.
Consider loading the data with Dask directly
 or using futures or delayed objects to embed the data into the graph without repetition.
See also https://docs.dask.org/en/stable/best-practices.html#load-data-with-dask for more information.
  warnings.warn(
/opt/hostedtoolcache/Python/3.13.15/x64/lib/python3.13/site-packages/distributed/client.py:3429: UserWarning: Sending large graph of size 19.08 MiB.
This may cause some slowdown.
Consider loading the data with Dask directly
 or using futures or delayed objects to embed the data into the graph without repetition.
See also https://docs.dask.org/en/stable/best-practices.html#load-data-with-dask for more information.
  warnings.warn(
Profile   : development
Operation : mean
Array     : (500, 500, 20) (size=small)
Workers   : 2
Wall time : 0.30s
Tasks     : 64  (214.8 tasks/s)
Peak mem  : 0.12 GiB
2. A/B-Test Configurations with benchmark_config()
Compare multiple DaskSetupConfig objects on the same xarray dataset.
Each config gets a fresh cluster so results are directly comparable.
# Build a small synthetic xarray dataset for benchmarking
np.random.seed(0)
arr = np.random.random((300, 90, 180)).astype("float32")
bench_ds = xr.Dataset(
    {"temperature": (["time", "lat", "lon"], arr)},
    coords={
        "time": np.arange(300),
        "lat":  np.linspace(-90, 90, 90),
        "lon":  np.linspace(-180, 180, 180),
    },
)
print(f"Dataset: {dict(bench_ds.sizes)}  size={bench_ds.nbytes / 1e6:.1f} MB")
Dataset: {'time': 300, 'lat': 90, 'lon': 180} size=19.4 MB
configs = {
    "cpu_2w":   DaskSetupConfig(workload_type="cpu",   max_workers=2, reserve_mem_gb=2.0),
    "io_1w":    DaskSetupConfig(workload_type="io",    max_workers=1, reserve_mem_gb=2.0),
    "mixed_2w": DaskSetupConfig(workload_type="mixed", max_workers=2, reserve_mem_gb=2.0),
}

results = benchmark_config(
    configs,
    bench_ds,
    operation="mean",
    repeats=2,
    verbose=True,
)

print("\nRanked by wall time:")
for r in sorted(results, key=lambda r: r.wall_time_seconds):
    print(f"  {r.summary_line()}")
[setup_dask_client] Configuration summary
temp/spill dir: /tmp/dask-3223
Workers: 2 | threads/worker: 1 | processes: True
Memory: total ~15.6 GiB | usable ~13.6 GiB | per-worker ~6.8 GiB
Compression: spill=auto | comm=False
'cpu_2w'                 | wall=0.01s ±0.00s | workers=2 | mem=0.12 GiB/peak
[setup_dask_client] Configuration summary
temp/spill dir: /tmp/dask-3223
Workers: 1 | threads/worker: 4 | processes: False
Memory: total ~15.6 GiB | usable ~13.6 GiB | per-worker ~13.6 GiB
Compression: spill=auto | comm=False
'io_1w'                  | wall=0.01s ±0.00s | workers=1 | mem=0.26 GiB/peak
[setup_dask_client] Configuration summary
temp/spill dir: /tmp/dask-3223
Workers: 2 | threads/worker: 2 | processes: True
Memory: total ~15.6 GiB | usable ~13.6 GiB | per-worker ~6.8 GiB
Compression: spill=auto | comm=False
'mixed_2w'               | wall=0.01s ±0.00s | workers=2 | mem=0.12 GiB/peak

Ranked by wall time:
  'cpu_2w'                 | wall=0.01s ±0.00s | workers=2 | mem=0.12 GiB/peak
  'mixed_2w'               | wall=0.01s ±0.00s | workers=2 | mem=0.12 GiB/peak
  'io_1w'                  | wall=0.01s ±0.00s | workers=1 | mem=0.26 GiB/peak
3. Worker Count Scaling
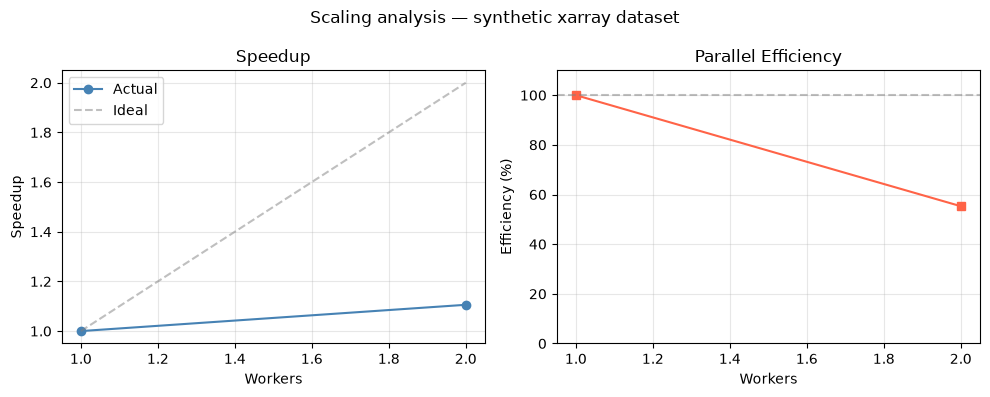
scaling_analysis() sweeps worker counts and reports speedup and parallel efficiency
relative to the single-worker baseline.
scaling = scaling_analysis(
    bench_ds,
    operation="mean",
    worker_counts=(1, 2),   # keep it short for the demo; add 4, 8 on real HPC
    base_config=DaskSetupConfig(
        workload_type="cpu",
        reserve_mem_gb=2.0,
        fallback_on_detection_failure=True,
    ),
    repeats=2,
    verbose=True,
)

print()
print(scaling.summary())
print(f"\nBest: {scaling.best().summary_line()}")
[scaling_analysis] running workers=1 (1/2)…
[setup_dask_client] Configuration summary
temp/spill dir: /tmp/dask-3223
Workers: 1 | threads/worker: 1 | processes: True
Memory: total ~15.6 GiB | usable ~13.6 GiB | per-worker ~13.6 GiB
Compression: spill=auto | comm=False
'workers=1'              | wall=0.01s ±0.00s | workers=1 | mem=0.06 GiB/peak
[scaling_analysis] running workers=2 (2/2)…
[setup_dask_client] Configuration summary
temp/spill dir: /tmp/dask-3223
Workers: 2 | threads/worker: 1 | processes: True
Memory: total ~15.6 GiB | usable ~13.6 GiB | per-worker ~6.8 GiB
Compression: spill=auto | comm=False
'workers=2'              | wall=0.01s ±0.00s | workers=2 | mem=0.12 GiB/peak

 Workers    Wall (s)   Speedup  Efficiency   Tasks/s
------------------------------------------------------
       1        0.01      1.00x     100.0%       0.0
       2        0.01      1.11x      55.3%       0.0

Best: 'workers=2'              | wall=0.01s ±0.00s | workers=2 | mem=0.12 GiB/peak
if PLOT:
    fig = scaling.plot(title="Scaling analysis — synthetic xarray dataset")
    if fig:
        plt.show()
4. Chunk Size Impact
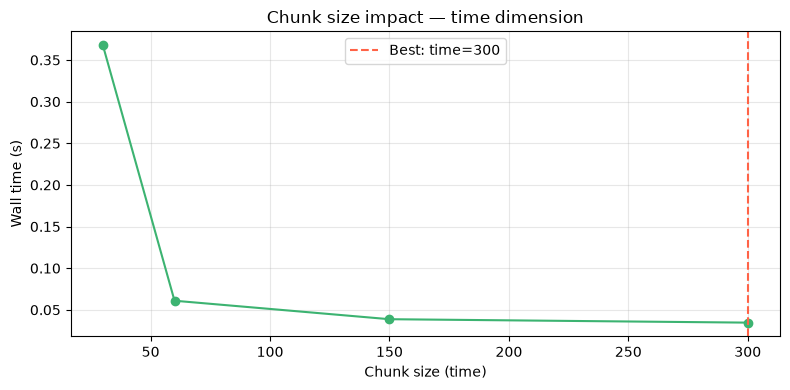
chunk_impact() uses a fixed running cluster and sweeps chunk sizes to find the
throughput sweet spot for a specific dataset and operation.
client, cluster, tmp = setup_dask_client(
    workload_type="cpu",
    max_workers=2,
    reserve_mem_gb=2.0,
    fallback_on_detection_failure=True,
    dashboard=False,
)

impact = chunk_impact(
    bench_ds,
    client,
    operation="mean",
    chunk_sizes=[
        {"time": 30,  "lat": 45, "lon": 90},
        {"time": 60,  "lat": 90, "lon": 180},
        {"time": 150, "lat": 90, "lon": 180},
        {"time": 300, "lat": 90, "lon": 180},
    ],
    repeats=2,
    verbose=True,
)

print()
print(impact.summary())
[setup_dask_client] Configuration summary
temp/spill dir: /tmp/dask-3223
Workers: 2 | threads/worker: 1 | processes: True
Memory: total ~15.6 GiB | usable ~13.6 GiB | per-worker ~6.8 GiB
Compression: spill=auto | comm=False
[chunk_impact] running {'time': 30, 'lat': 45, 'lon': 90} (1/4)…
/opt/hostedtoolcache/Python/3.13.15/x64/lib/python3.13/site-packages/distributed/client.py:3429: UserWarning: Sending large graph of size 18.54 MiB.
This may cause some slowdown.
Consider loading the data with Dask directly
 or using futures or delayed objects to embed the data into the graph without repetition.
See also https://docs.dask.org/en/stable/best-practices.html#load-data-with-dask for more information.
  warnings.warn(
"{'time': 30, 'lat': 45, 'lon': 90}" | wall=0.37s ±0.23s | workers=2 | mem=0.12 GiB/peak | tasks/s=247.4
[chunk_impact] running {'time': 60, 'lat': 90, 'lon': 180} (2/4)…
/opt/hostedtoolcache/Python/3.13.15/x64/lib/python3.13/site-packages/distributed/client.py:3429: UserWarning: Sending large graph of size 18.54 MiB.
This may cause some slowdown.
Consider loading the data with Dask directly
 or using futures or delayed objects to embed the data into the graph without repetition.
See also https://docs.dask.org/en/stable/best-practices.html#load-data-with-dask for more information.
  warnings.warn(
"{'time': 60, 'lat': 90, 'lon': 180}" | wall=0.06s ±0.00s | workers=2 | mem=0.12 GiB/peak | tasks/s=262.5
[chunk_impact] running {'time': 150, 'lat': 90, 'lon': 180} (3/4)…
/opt/hostedtoolcache/Python/3.13.15/x64/lib/python3.13/site-packages/distributed/client.py:3429: UserWarning: Sending large graph of size 18.54 MiB.
This may cause some slowdown.
Consider loading the data with Dask directly
 or using futures or delayed objects to embed the data into the graph without repetition.
See also https://docs.dask.org/en/stable/best-practices.html#load-data-with-dask for more information.
  warnings.warn(
/opt/hostedtoolcache/Python/3.13.15/x64/lib/python3.13/site-packages/distributed/client.py:3429: UserWarning: Sending large graph of size 18.54 MiB.
This may cause some slowdown.
Consider loading the data with Dask directly
 or using futures or delayed objects to embed the data into the graph without repetition.
See also https://docs.dask.org/en/stable/best-practices.html#load-data-with-dask for more information.
  warnings.warn(
/opt/hostedtoolcache/Python/3.13.15/x64/lib/python3.13/site-packages/distributed/client.py:3429: UserWarning: Sending large graph of size 18.54 MiB.
This may cause some slowdown.
Consider loading the data with Dask directly
 or using futures or delayed objects to embed the data into the graph without repetition.
See also https://docs.dask.org/en/stable/best-practices.html#load-data-with-dask for more information.
  warnings.warn(
/opt/hostedtoolcache/Python/3.13.15/x64/lib/python3.13/site-packages/distributed/client.py:3429: UserWarning: Sending large graph of size 18.54 MiB.
This may cause some slowdown.
Consider loading the data with Dask directly
 or using futures or delayed objects to embed the data into the graph without repetition.
See also https://docs.dask.org/en/stable/best-practices.html#load-data-with-dask for more information.
  warnings.warn(
"{'time': 150, 'lat': 90, 'lon': 180}" | wall=0.04s ±0.00s | workers=2 | mem=0.12 GiB/peak | tasks/s=129.0
[chunk_impact] running {'time': 300, 'lat': 90, 'lon': 180} (4/4)…
"{'time': 300, 'lat': 90, 'lon': 180}" | wall=0.03s ±0.00s | workers=2 | mem=0.25 GiB/peak | tasks/s=86.6

               Chunks                   Wall (s)   Mem GiB   Tasks/s
--------------------------------------------------------------------
{'time': 30, 'lat': 45, 'lon': 90}          0.37      0.12     247.4
{'time': 60, 'lat': 90, 'lon': 180          0.06      0.12     262.5
{'time': 150, 'lat': 90, 'lon': 18          0.04      0.12     129.0
{'time': 300, 'lat': 90, 'lon': 18          0.03      0.25      86.6

Optimal: {'time': 300, 'lat': 90, 'lon': 180}
/opt/hostedtoolcache/Python/3.13.15/x64/lib/python3.13/site-packages/distributed/client.py:3429: UserWarning: Sending large graph of size 18.54 MiB.
This may cause some slowdown.
Consider loading the data with Dask directly
 or using futures or delayed objects to embed the data into the graph without repetition.
See also https://docs.dask.org/en/stable/best-practices.html#load-data-with-dask for more information.
  warnings.warn(
/opt/hostedtoolcache/Python/3.13.15/x64/lib/python3.13/site-packages/distributed/client.py:3429: UserWarning: Sending large graph of size 18.54 MiB.
This may cause some slowdown.
Consider loading the data with Dask directly
 or using futures or delayed objects to embed the data into the graph without repetition.
See also https://docs.dask.org/en/stable/best-practices.html#load-data-with-dask for more information.
  warnings.warn(
if PLOT:
    fig = impact.plot(dim="time", title="Chunk size impact — time dimension")
    if fig:
        plt.show()
client.close()
cluster.close()
print("Cluster closed.")
Cluster closed.
5. Exporting Results
ScalingResult and ChunkImpactResult both have a .to_dataframe() method for easy
export to CSV or further analysis.
try:
    df_scaling = scaling.to_dataframe()
    print("Scaling results:")
    print(df_scaling[["workers", "wall_time_s", "speedup", "efficiency"]].to_string(index=False))
except ImportError:
    print("pandas not installed — .to_dataframe() requires pandas")
Scaling results:
 workers  wall_time_s  speedup  efficiency
       1     0.007830 1.000000    1.000000
       2     0.007081 1.105858    0.552929
Performance Tuning Checklist
Choose the right
workload_typeby the GIL, not by “I/O vs compute”:cpufor NetCDF/HDF5 reads and Python-heavy code,iofor Zarr and object storage (they release the GIL),mixedfor pipelines doing both.Hit the 256–512 MiB chunk target — use
recommend_chunks()orchunk_impact()to guide this.Check parallel efficiency — if
scaling_analysis()shows <70% efficiency at 4 workers, the bottleneck is not compute (check I/O, shuffle, or task graph overhead).Enable spill compression —
spill_compression="lz4"reduces spill latency on SSDs (needspip install lz4; an uninstalled codec stops workers starting, so"auto"is the safe default).Tune thresholds from real spill — call
tune_memory_thresholds(client)between stages. (adaptive_memory=Trueruns it once at startup, before anything has spilled, so it only ever tightens.)
See the Benchmarking wiki page for full API documentation.